environmental benefit of wastewater treatment plants in mountainous areas in the alps

|
Comparison of technology, costs and environmental benefit of wastewater treatment plants in mountainous areas in the alps |

|
Oxygen demand
Oxygen transfer
Conclusions
- Demand for degradation of organic compounds: A major portion of organic substances in the (mostly pre-clarified) wastewater influent flow is quickly microbially metabo-lised. About one third is respirated to CO2 in order to produce energy and about two thirds is transformed to body mass of microbial organisms. A part of the organic load is adsorbed and transformed with delay.
- Endogenous respiration: Independent from the current wastewater loading micro organisms show a basic respiration. Additionally continuous decay of organisms and the metabolism of lyse products requires a minimum amount of oxygen (sludge stabili-sation or -reduction at low loading).
- Demand for nitrogen elimination: Oxygen is required for the oxidation of ionised ammonia NH4 to nitrate NO3. A major portion of this amount of oxygen is regained during denitrification (reduction of nitrate to nitrogen N2). A significant portion of the ammonia nitrogen is incorporated into the biomass without any oxygen consumption.
O2,demand = 0.5 * (organ. loading) + 0.1 * (biomass) + 1.71 * (eliminated nitrogen)
The organic loading is calculated in kg BOD per day and the biomass is the product of the sludge concentration multiplied with the volume of the aerated activated sludge tank. The nitrified/denitrified nitrogen load is about half of the influent nitrogen load fed to the biological treatment (10 g N/PE * PEmax / 2). In order to consider daily load variations the maximum oxygen demand per hour is increased by 50 %. A simplified approach assumes an oxygen demand which is about twice as high as the BOD-load.
Berlin Refuge: O2,demand = 0.5 * 10.7 kg BOD/d + 0.1 * (9.6m3 * 4.0 kg SS/m 3) + 1.71 * (2.6 kg N/d /2) = 5.35 kg + 3.84 kg + 2.22 kg = 11.4 kg O2/d O2,demand
= 11.4 * 1.5 / 24 = 0.71 kg O 2 /h Approach: O2,demand = 2 * 10.7 kg BOD/d / 24 h = 0.89 kg O2 /h
Coburg Refuge: O2,demand = 0.5 * 7.2 kg BOD/d + 0.1 * (10.35 m3 * 3.6 kg SS/m 3) + 1.71 * (1.8 kg N/d /2) = 3.6 kg + 3.73 kg + 1.54 kg = 8.9 kg O2/d O2,demand
= 8.9 * 1.5 / 24 = 0.55 kg O 2 /h Approach : O2,Bedarf = 2 * 7.2 kg BOD/d / 24 h = 0.60 kg O2/h
Konstanz Refuge: O2,demand = 0.5 * 4.4 kg BOD/d + 0.1 * (7.2 m3 * 4.0 kg SS/m 3) + 1.71 * (1.1 kg N/d /2) = 2.2 kg + 2.88 kg + 0.94 kg = 6.0 kg O2/d O2,demand
= 6.0 * 1.5 / 24 = 0.38 kg O 2 /h Approach : O2,Bedarf = 2 * 4.4 kg BOD/d / 24 h = 0.37 kg O2/h
Lamsenjoch Refuge: O2,demand = 0.5 * 8.0 kg BOD/d + 0.1 * (11.8 m3 * 3.0 kg SS/m 3) + 1.71 * (2.0 kg N/d /2) = 4.0 kg + 3.54 kg + 1.71 kg = 9.25 kg O2/d O2,demand
= 9.25 * 1.5 / 24 = 0.58 kg O 2 /h Approach : O2,Bedarf = 2 * 8.0 kg BOD/d / 24 h = 0.67 kg O2/h
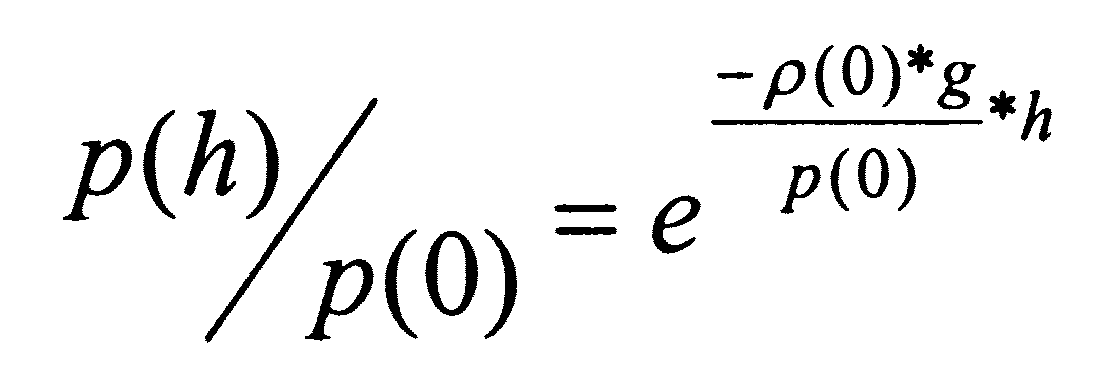
... barometric altitude formula
p(h)... pressure in considered altitude [N/m2]
p(0)... pressure at sea level [N/m2 ]
r(0)... density of air at sea level [kg/m3 ]
g... gravity [N/kg]
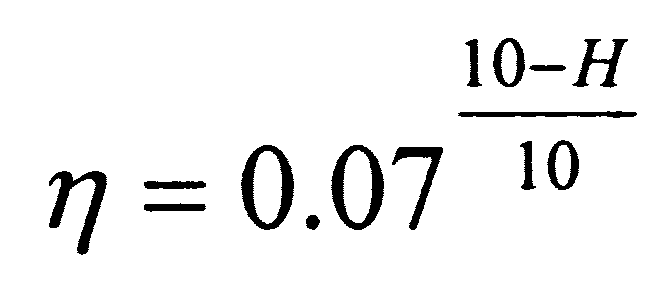
... efficiency of the oxygen transfer [-]
H... water depth
Berlin Refuge : 2 * LP200 linear pumps for aeration and 1 * LP200 for syphons O2,transfer = 27 m3 /h * η * α * p(2044m)/p(0) * 0.28 kg O2/m3 =
= 27 * 0.104 * 0.8 * 0.77 * 0.28 = 0.48 kg O2/h

and 
Coburg Refuge : 2 * piston compressors (4.8 und 4.10) O2,transfer = 15 m3/h * η * α * p(1917m)/p(0) * 0.28 kg O2/m3 =
= 15 * 0.129 * 0.8 * 0.79 * 0.28 = 0.34 kg O2/h

and 
Konstanz Refuge : 2 * LP200 linear pump with 12 m3/h each O2,transfer = 24 m3/h * η * α * p(1688m)/p(0) * 0.28 kg O2/m3 =
= 24 * 0.099 * 0.8 * 0.81 * 0.28 = 0.43 kg O2/h

and 
Lamsenjoch Refuge : 2 * piston compressors (4.10 und teilweise 4.8) O2,transfer = 13 m3/h * η * α * p(1958m)/p(0) * 0.28 kg O2/m3 =
= 13 * 0.129 * 0.8 * 0.78 * 0.28 = 0.29 kg O2/h

and 
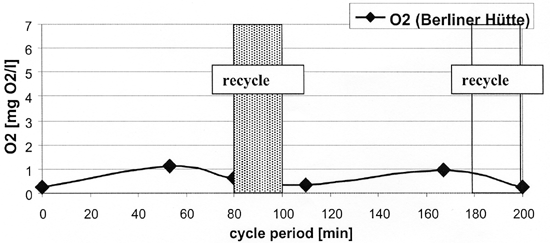
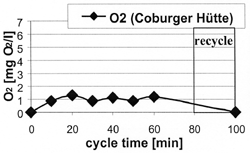
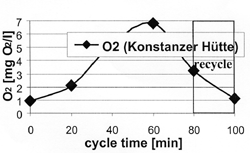
Fig. 1: 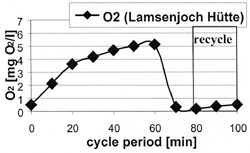
Oxygen concentration profiles during a Biocos-operation cycle. The oxygen concentration increases during continuous aeration in the B-tank and decreases during the discharge phase and the recycle phase, when all or a part of the compressed air is used to operate the syphons. Note the different load situations of the treatment plants (Tab.1).
site
[%]Berlin
Tab. 1: Calculated oxygen demand (at monitoring dates presented in Fig.1) in relation to the actual oxygen transfer.
![]() back to comparison of technologies
back to comparison of technologies