environmental benefit of wastewater treatment plants in mountainous areas in the alps
|
Comparison of technology, costs and environmental benefit of wastewater treatment plants in mountainous areas in the alps |
Site description and boundary conditions
Design and treatment efficiency
maximum daily organic load [PE]
115
maximum hydraulic load [m3/d]
1.5
annual organic load [kg BOD/a]
360
altitude [m a.s.l.]
1560
sensitivity [hydrogeology, protected area ...]
nature reserve, limestone
lagal requirements [BOD elimination]
>80 %
operation period [season]
summer
energy supply [type, kW]
PV, 0.9; Aggregate, 11
means of transport [type]
supply cable car
existing WWTP [type, condition, volume l/PE]
2-chambers, poor condition, 13
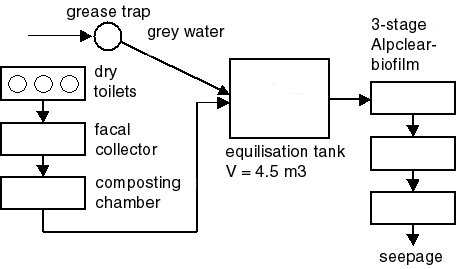
Fig. 4.6: Flow-scheme of the WWTP Brunnstein Refuge
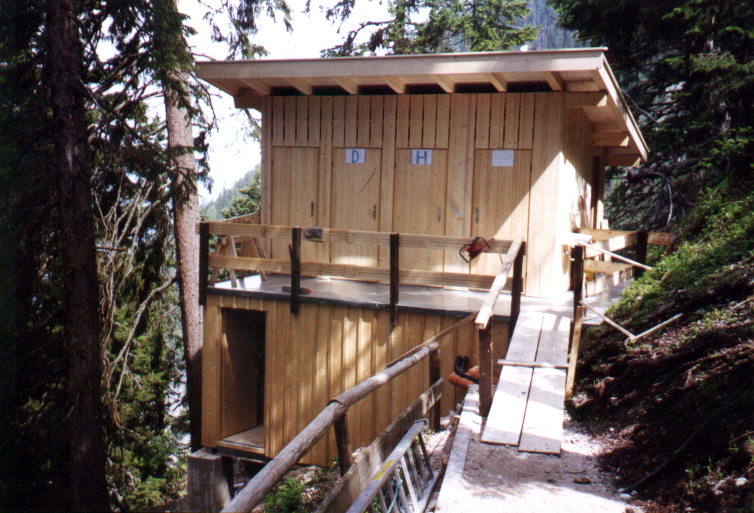
Fig. 4.7a: View of the 3-storied sanitary building (toilets and treatment units)
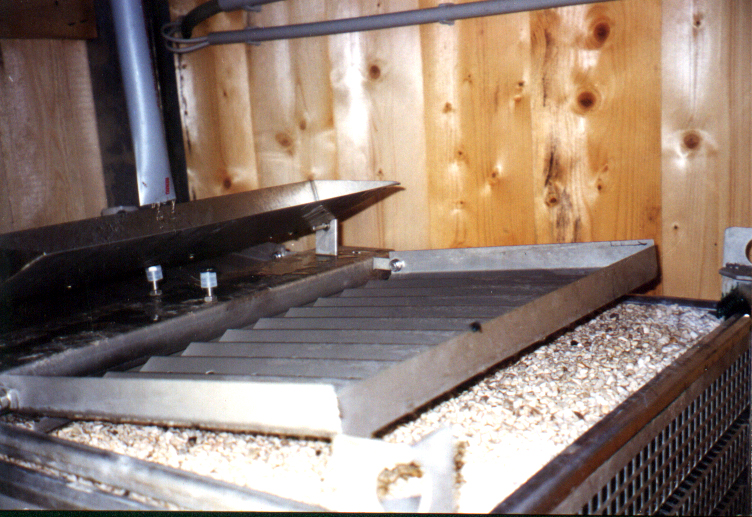
Fig. 4.7b: Soilfilter cage and splash compensator for the wastewater distribution
Loading of the biological treatment
WWTP Brunnstein Refuge seasonal average max. week max. day loading [PE35] *) 28 38 115 BOB 5-load [kg/d] 1.0 1.3 4.0 influent flow Q [m3/d] 0.5 1.3 1.5
*) PE 60 -specific organic load after dry toilets and grease trap: 35 g BOD 5 / PW60.d
Design of the composting process
Mtotal, wet = 240 g/PW 60 x 6.000 PW60 x 2 = ca. 2.900 kg/a (total spareted solids)
Factor 2 for added composting material (straw, sawdust,...)960 kg Compost in 3 compost toilets -> 2 times emptying / year
Mtotal, stabilized = ca. 960 kg/a (stabilized considering evaporation)
Design of soilfilters according to the surface loading in max. week
Vfixed bed = ca. 1.4 x 3 = 4.2 m3; OBF = ca. 4.2 m3 * 120 m2 / m3 = 500 m 2 (biofilm surface)
BBF = 1300 g BOD5 / 500 m2 = 2.7 g BOD5 / m2.d (biofilm surface load)
Energy demand:
max. power
[W]max. electric work
[kWh/d]mean electric work
[kWh/d]130 0,56 0,38
Treatment efficiency:
date
[dd.mm.yyyy]
CODeffluent [mg/l] NH4-N effluent [mg/l] NO3-N effluent [mg/l] CODelimination [%] Nelimination [%] loading [% of PE max] 31.08.2000 150 2 15 87 78 48 22.07.2001 45 0.5 16 98 91