environmental benefit of wastewater treatment plants in mountainous areas in the alps
|
Comparison of technology, costs and environmental benefit of wastewater treatment plants in mountainous areas in the alps |
Site description and boundary conditions
Design and treatment efficiency
maximum daily organic load [PE]
180 maximum hydraulic load [m3/d]
6.4
annual organic load [kg BOD/a]
330
altitude [m a.s.l.]
1970
sensitivity [hydrogeology, protected area ...]
well, limestone
lagal requirements [BOD elimination]
90 %
operation period [season]
summer
energy supply [type, kW]
Photovoltaic, 0.3; Aggregate, 17
means of transport [type]
supply cable car
existing WWTP [type, condition, volume l/PE]
grease trap, 2-chambers, poor condition
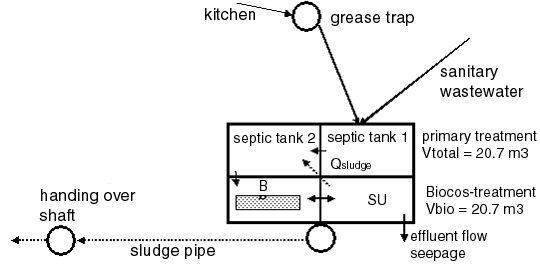
Fig. 4.8: Flow scheme of the WWTP Coburg Refuge
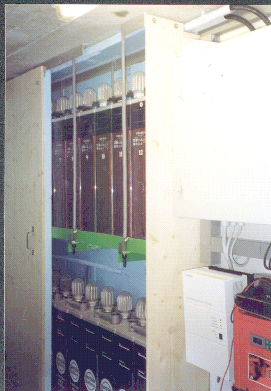
Fig. 4.10: Set of batteries in the background and charger and inverter in front.
Loading of the biological treatment
WWTP Coburg Refuge seasonal average max. week max. day loading [PE40] 40 80 180 BOD 5-load [kg/d] 1.6 3.2 7.2 influent flow Q [m3/d] 3.4 5.0 7.5
Design according to the F/M ratio in the max. weekVaerob = 3.0 x 1.5 x 2.3 m = 10.35 m3 (volumen B-tank)
Maerob = 10.35 m3 x 3.6 kg SS/m3 * 3.7 = 26 kg SS (aerobic sludge mass)
BTS = 3.2 kg BOD5/d : 26 kg SS = 0.12 kg/kg.d (aerobic sludge loading)
OB = 3.2 x 3 kg O2/kg BOD5 : 24 h = 0.4 kg O2 /h (oxygen demand)
Energy demand
max. power
[W]max. electric work
[kWh/d]mean electric work
[kWh/d]1200 18.7 18.7
Treatment efficiency
date
[dd.mm.yyyy]
CODeffluent [mg/l] NH4-Neffluent [mg/l] NO3-Neffluent [mg/l] CODelimination [%] Nelimination [%] loading
[% v. PWmax]29.07.1999 315 72 4 81 37 -- 08.09.2000 70 41 1 94 74 37 21.07.2001 55 7 16 92 62 43