environmental benefit of wastewater treatment plants in mountainous areas in the alps
|
Comparison of technology, costs and environmental benefit of wastewater treatment plants in mountainous areas in the alps |
Site description and boundary conditions
Design and treatment efficiency
maximum daily organic load [PE]
157 maximum hydraulic load [m3/d]
12
annual organic load [kg BOD/a]
570
altitude [m a.s.l.]
2208
sensitivity [hydrogeology, protected area ...]
granite, river
lagal requirements [BOD elimination]
80 %
operation period [season]
summer + winter
energy supply [type, kW]
water power plant
means of transport [type]
supply cable car
existing WWTP [type, condition, volume l/PE]
3-chambers, poor condition
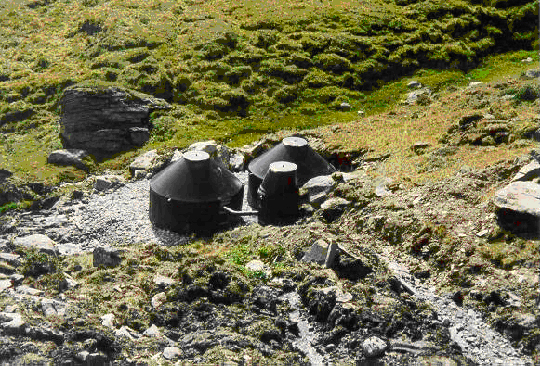
Fig. 4.14: Distribution shaft and seepage tanks DN 2500
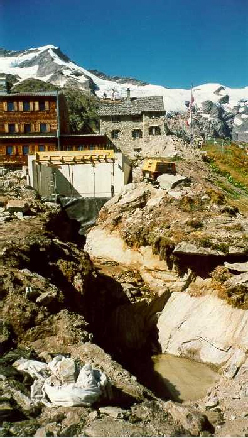
Fig. 4.15: The building for the SBR-tanks, the excavation for the buffer tank and the Essen-Rostock Refuge in the background.
Fig. 4.16.: Flow scheme of the WWTP Essen-Rostock Refuge
Loading of the biological treatment
WWTP Essen-Rostock Refuge seasonal average max. week max. day loading [PE60] 53 130 157 BOD5-load [kg/d] 3.2 7.8 9.42 influent flow Q [m3/d] 5 10 12
Design according to the F/M ratio in the max. week
Vaerob = 2 x 13 = 26 m 3 (volume 2 x SBR-tank)
Maerob = 26 m3 x 4.5 kg SS/m3 x 20 / 24 = 97 kg SS (aerobic sludge mass)
BTS = 7.8 kg BOD5 /d / 97 kg SS = 0.08 kg/kg.d (aerobic F/M ratio with sludge stabilization)
OB = 7,8 x 3 kg O2 /kg BODB5 / 24 h = 1,0 kg O2/ h (oxygen demand)
Energy demand
max. power
[W]max. electric work
[kWh/d]mean electric work
[kWh/d]2000 18 18
Treatment efficiency
date
[dd.mm.yyyy]
CODeffluent [mg/l] NH4 -Neffluent [mg/l] NO3 -Neffluent [mg/l] CODelimination [%] Nelimination [%] loading
[% of PEmax ]10.08.2000 48 3 13,6 93 54 67 05.05.2001 40 0,5 9,7 90 51 10