environmental benefit of wastewater treatment plants in mountainous areas in the alps
|
Comparison of technology, costs and environmental benefit of wastewater treatment plants in mountainous areas in the alps |
Site description and boundary conditions
Design and treatment efficiency
maximum daily organic load [PE]
110 maximum hydraulic load [m3/d]
11 annual organic load [kg BOD/a]
230
altitude [m a.s.l.]
1708
sensitivity [hydrogeology, protected area ...] granite, creek
legal requirements [BOD elimination]
80%
operation period [season]
summer
energy supply [type, kW]
water power plant, 22
means of transport [type]
lorry
existing WWTP [type, condition, volume l/PE]
8-chambers, good condition, 190
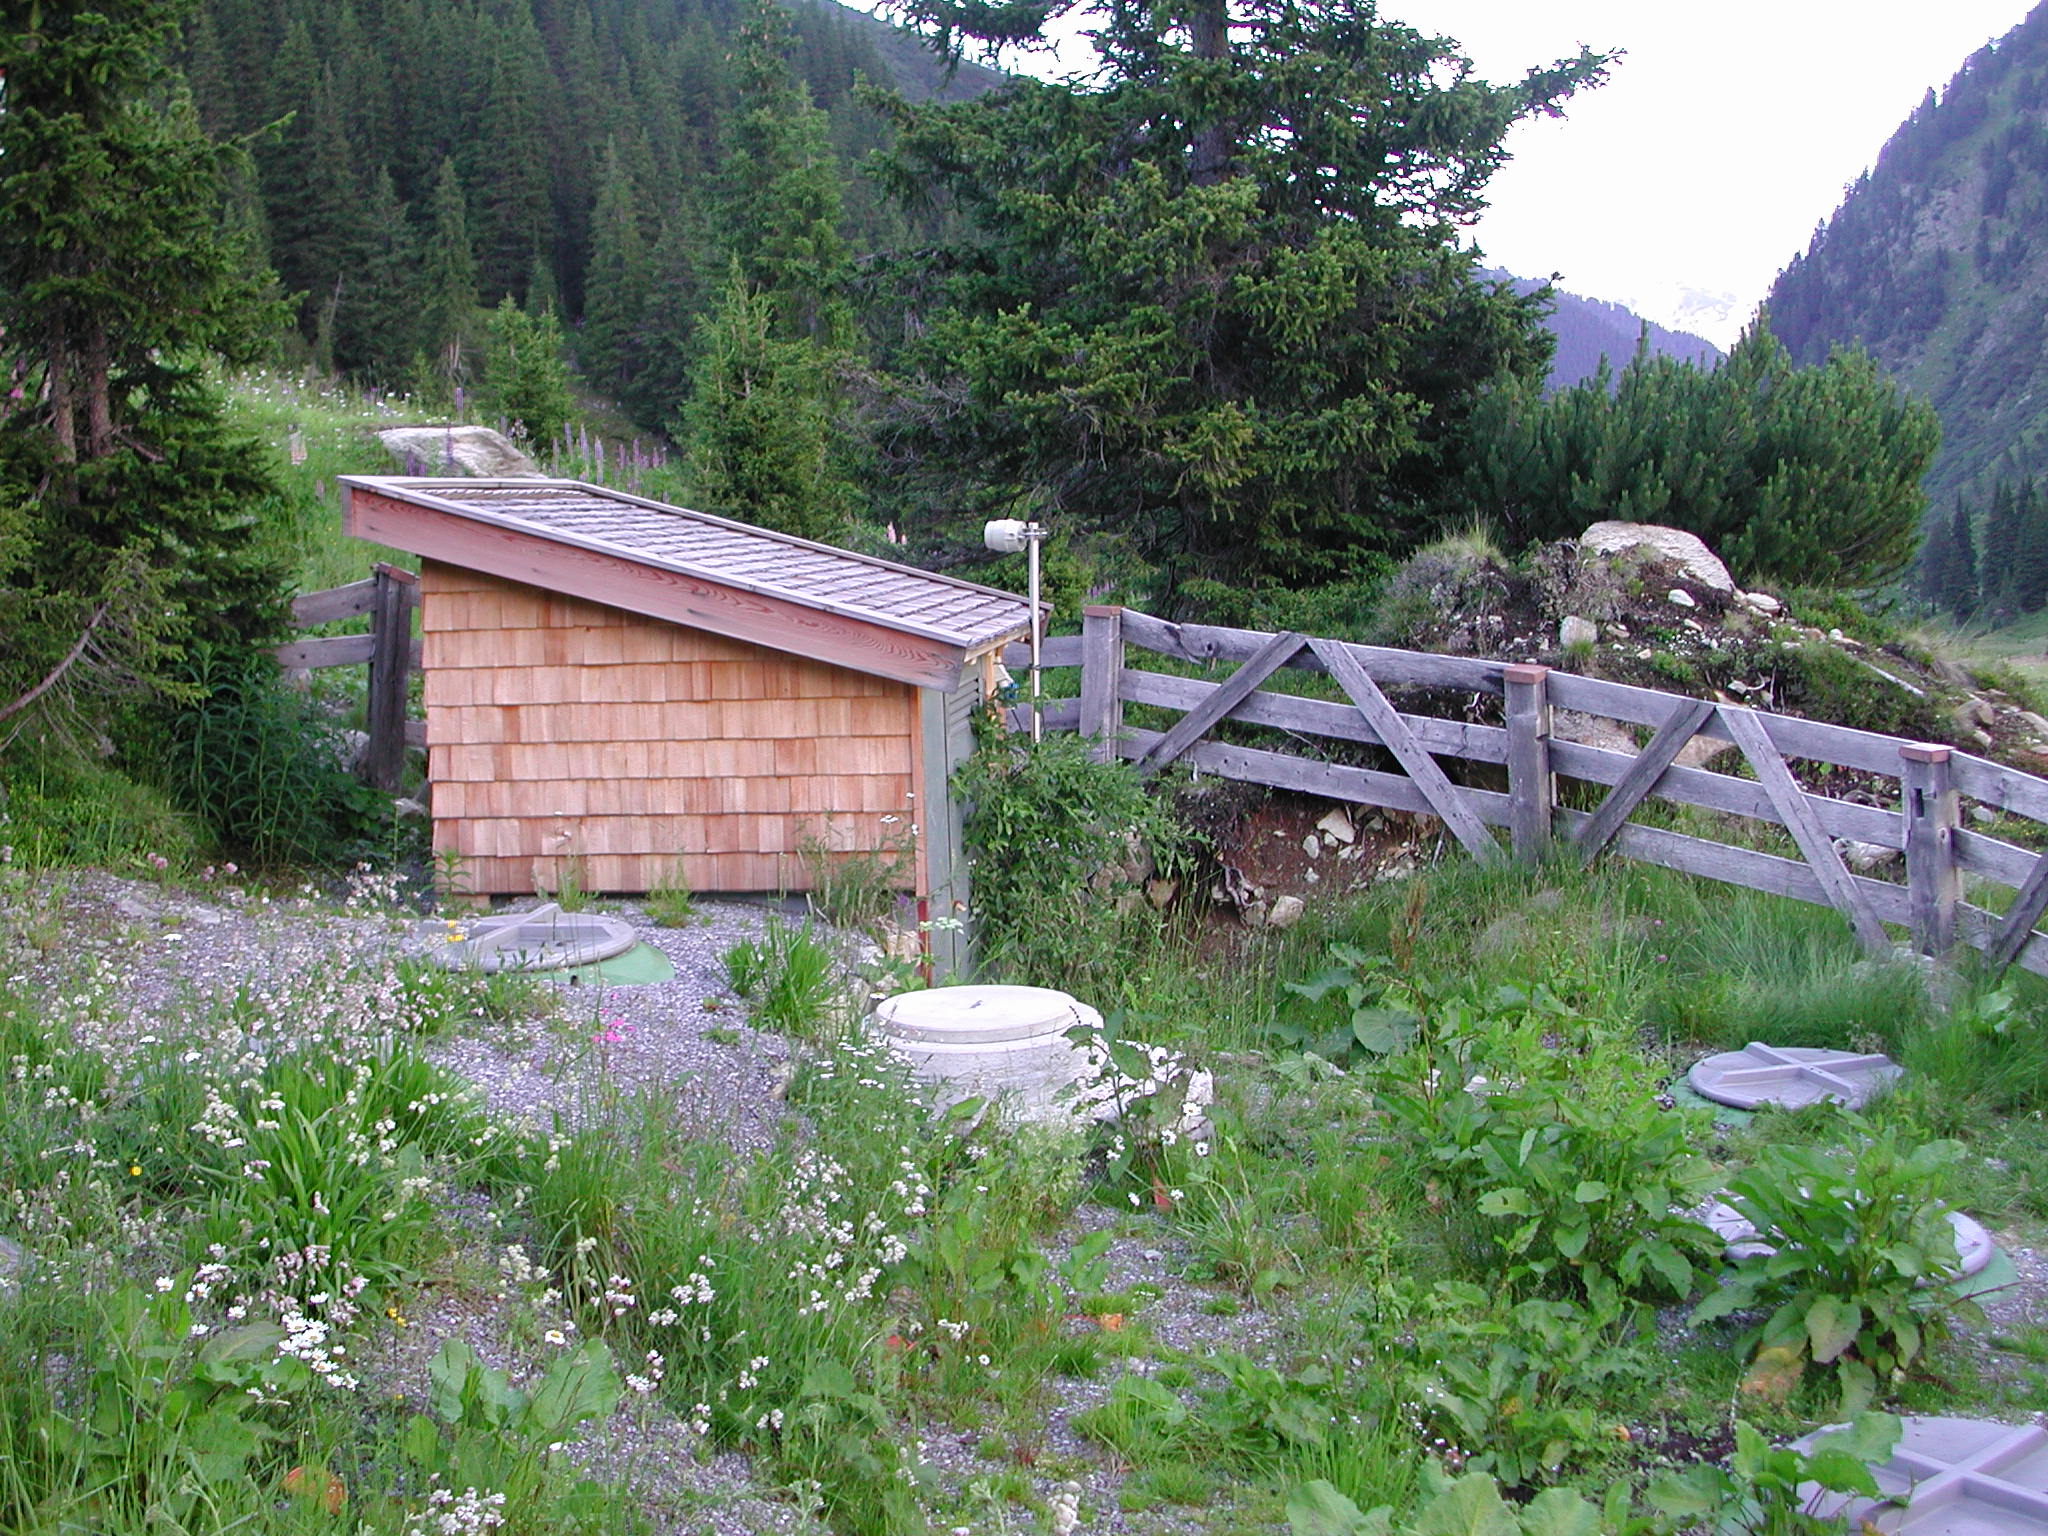
Fig. 4.26: View of the WWTP Konstanz Refuge showing the 3 septic tanks at the left hand side and the tanks of the Biocos- System at the right hand side.
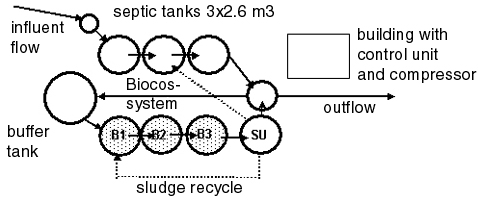
Fig. 4.27: Flow-scheme of the WWTP Konstanz-Refuge.
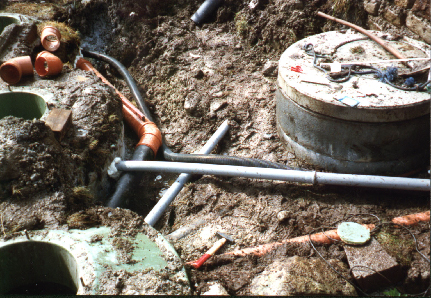
Fig. 4.28: Reuse of all existing tanks with new applications required a new piping of the wastewater-, air- and control-lines.
Loading of the biological treatment
WWTP Konstanz Refuge seasonal average max. week max. day loading [PE40] 38 85 110 BOD5-load [kg/d] 1.5 3.4 4.4 influent flow Q [m3/d] 4.2 8.0 11.0
Design according to the F/M ratio in the max. week
Vaerob = 7.2 m3 (volume B-tank)
Maerob = 7.2 m 3 x 4 kg SS/m3 = 28.8 kg SS (aerobic sludge mass)
BSS = 3.4 kg BOD5/d / 28.8 kg SS = 0.12 kg/kg.d (aerobic sludge loading)
OB = 3.4 x 3 kg O2 /kg BOD5 / 24 h = 0.42 kg O2/h (oxygen demand)
Energy demand
max. power [W] max. electric work
[kWh/d]mean electric work
[kWh/d]475 11.2 11.2
Treatment efficiency
date
[dd.mm.yyyy]
CODeffluent [mg/l] NH4-Neffluent [mg/l] NO3-Neffluent [mg/l] CODelimination [%] Nelimination [%] loading
[% of PEmax ]12.08.1999 30 13 14 97 77 25.09.2000 40 0 19 97 77 17.07.2001