environmental benefit of wastewater treatment plants in mountainous areas in the alps
|
Comparison of technology, costs and environmental benefit of wastewater treatment plants in mountainous areas in the alps |
Site description and boundary conditions
Design and treatment efficiency
maximum daily organic load [PE]
200 maximum hydraulic load [m3/d]
15 annual organic load [kg BOD/a]
490
altitude [m a.s.l.]
1958
sensitivity [hydrogeology, protected area ...] nature reserve, limestone
lagal requirements [BOD elimination]
80%
operation period [season]
summer
energy supply [type, kW]
aggregate
means of transport [type]
4WD existing WWTP [type, condition, volume l/PE]
2-chambers, poor condition, 57
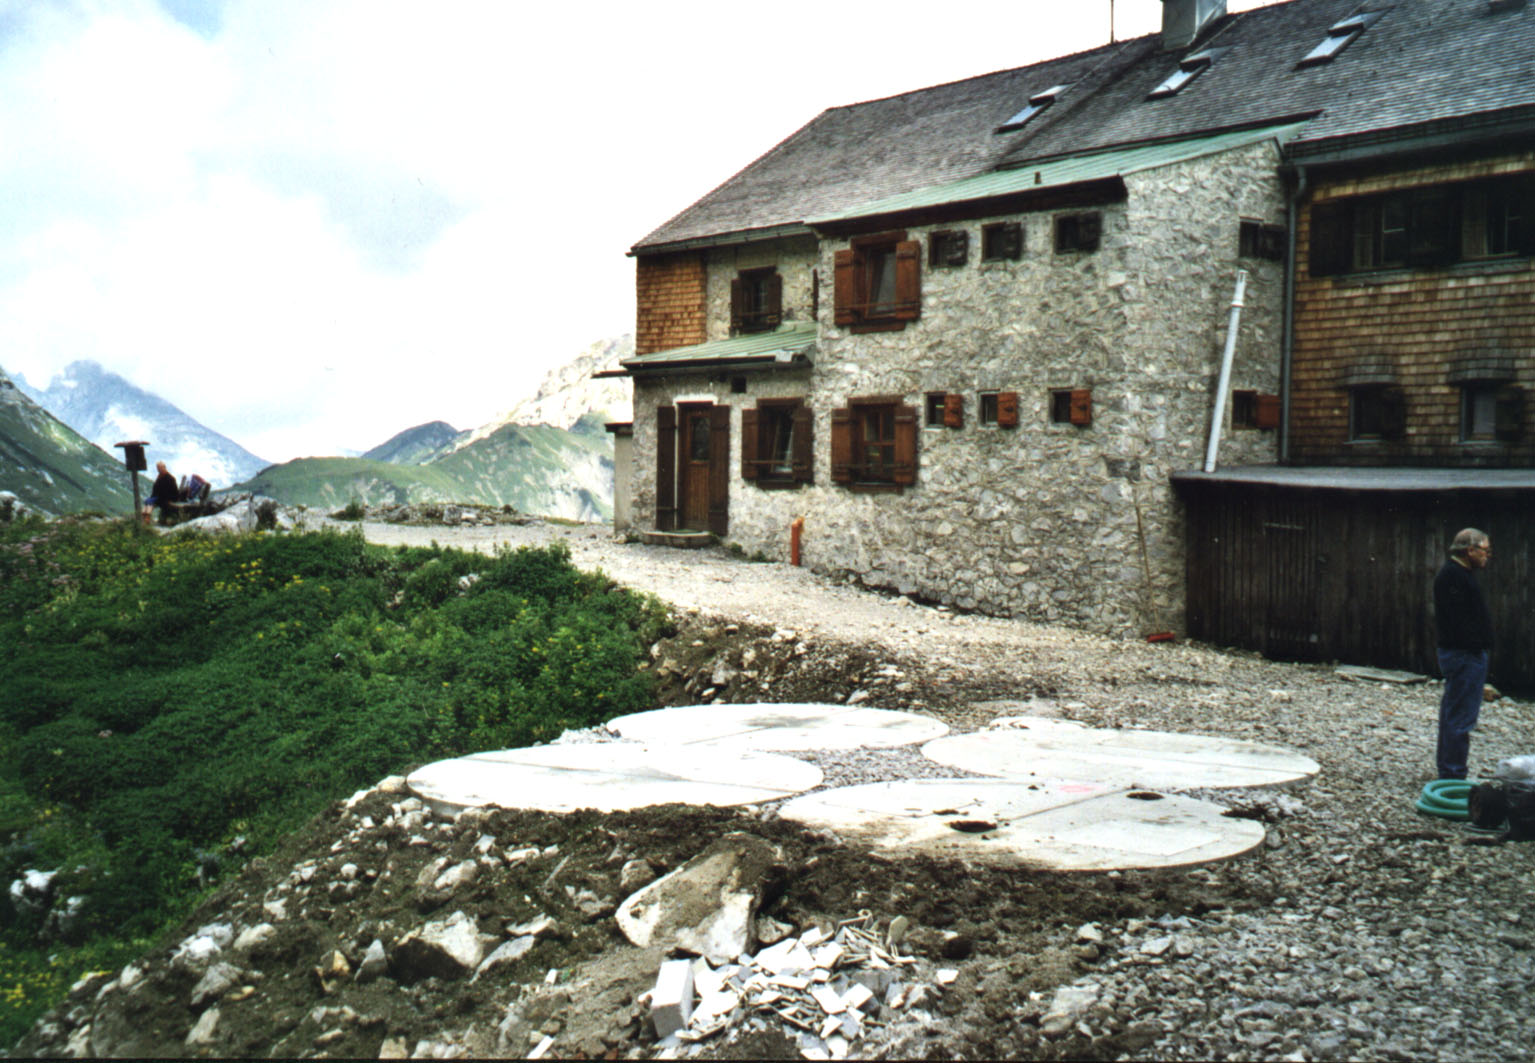
Fig. 4.29: 4 tanks made of prefabricated concrete parts at the backside of the Lamsenjoch Refuge.
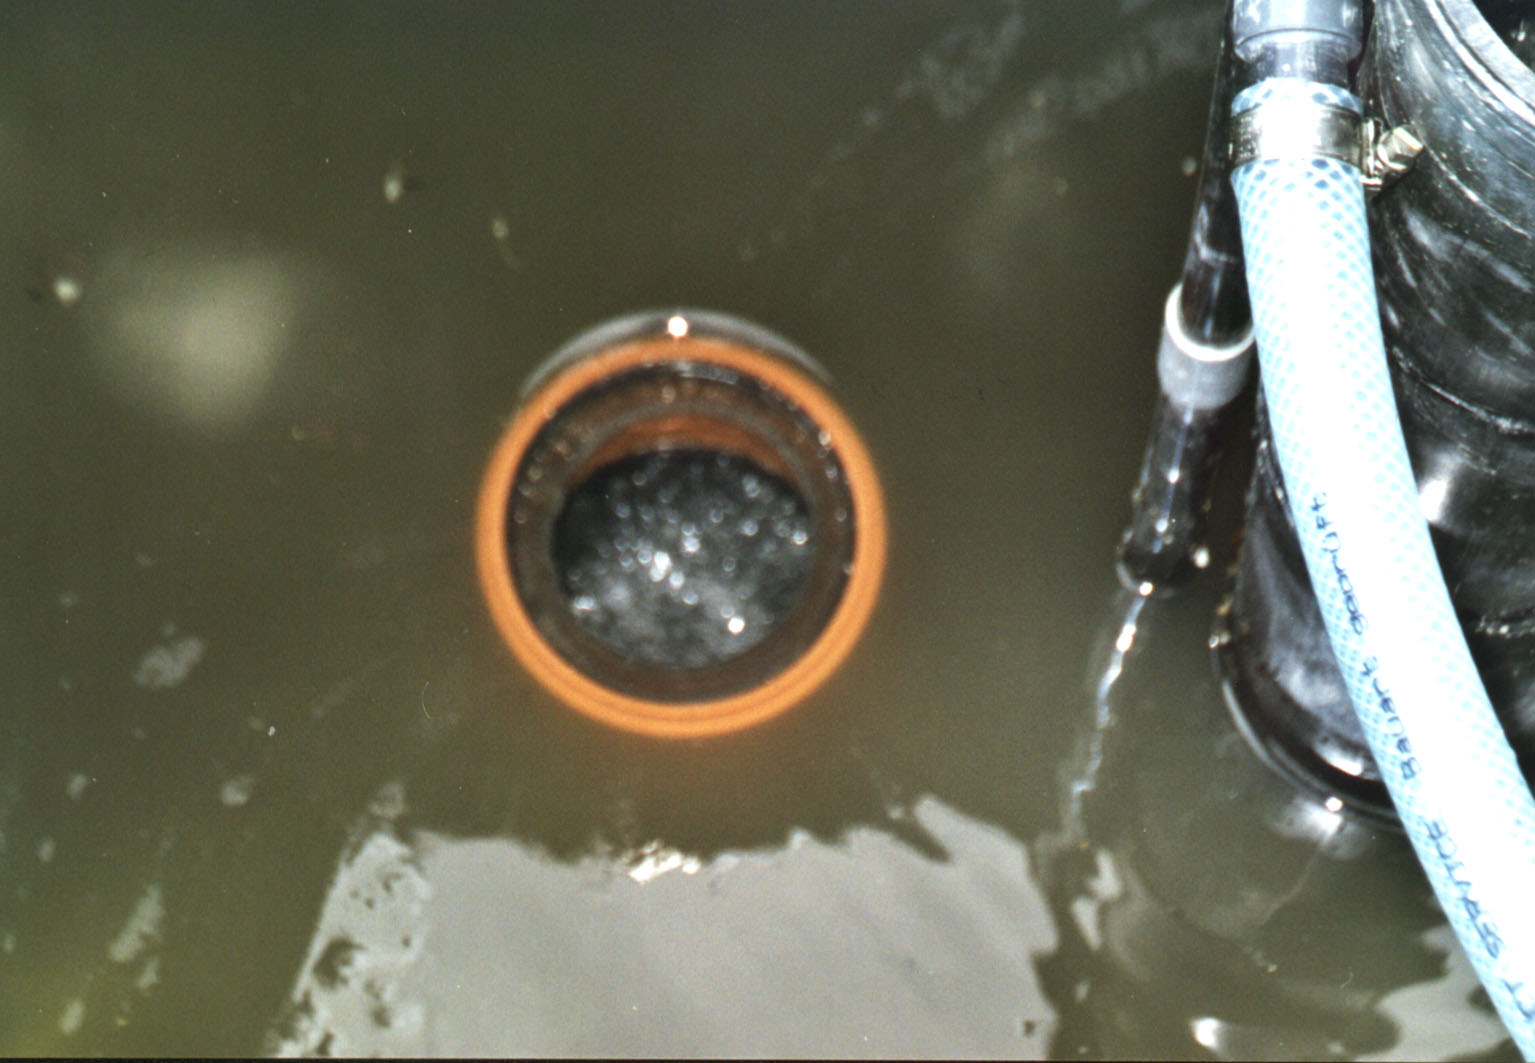
Fig. 4.30: Time controlled floating sludge withdrawal operated by compressed air.
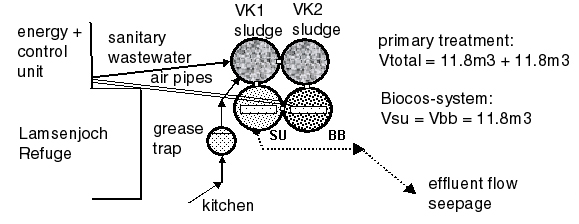
Fig. 4.31: Flow-scheme of the WWTP Lamsenjoch Refuge
Belastung Biologie
WWTP Lamsenjoch Refuge saesonal average max. week max. day loading [PE40] 60 128 200 BOD5-load [kg/d] 2.4 5.1 8.0 influent flow Q [m3/d] 4.3 10.5 15.0
Bemessung über die Schlammbelastung in max. Woche
Vaerob = 11.8 m3 (volume B-tank)
Maerob = 11.8 m 3 x 3,0 kg SS/m3 = 35.4 kg SS (aerobic sludge mass)
BSS = 5.1 kg BOD5 /d / 35 kg SS = 0.14 kg/kg.d (aerobic sludge loading)
OB = 5.1 x 3 kg O2 /kg BOD5 / 24 h = 0.63 kg O2/h (oxygen demand)
Energy demand
max. power
[W]max. electric work
[kWh/d]mean electric work
[kWh/d]1.375 22 22
Reinigungsleistungen
date
[dd.mm.yyyy]
CODeffluent [mg/l] NH4-N effluent [mg/l] NO3-N effluent [mg/l] CODelimination [%] Nelimination [%] loadingg [% of PE max ] 01.09.1999 185 105 1.4 86 22 10.10.2001 60 154 0.0 98 20