environmental benefit of wastewater treatment plants in mountainous areas in the alps
|
Comparison of technology, costs and environmental benefit of wastewater treatment plants in mountainous areas in the alps |
Site description and boundary conditions
Design and treatment efficiency
maximum daily organic load [PE]
98 maximum hydraulic load [m3/d]
3 annual organic load [kg BOD/a]
123
altitude [m a.s.l.]
1633
sensitivity [hydrogeology, protected area ...] nature reserve, limestone
lagal requirements [BOD elimination]
80%
operation period [season]
summer
energy supply [type, kW]
photovoltaic, 0.4
aggregate, 3
means of transport [type]
lorry existing WWTP [type, condition, volume l/PE]
3-chambers, good condition, 156
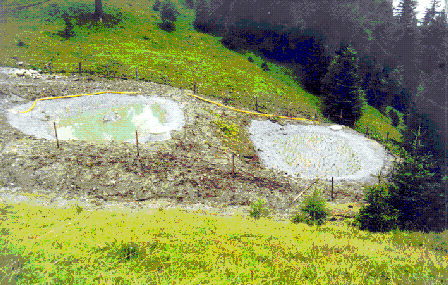
Fig. 4.32: Two stage biological treatment system including a pond and a vertical flow soil filter
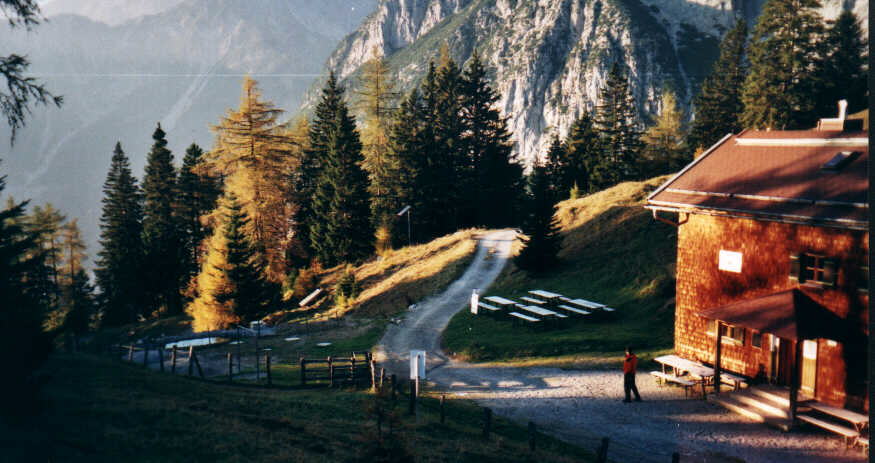
Fig. 4.33: Location and lay-out of the WWTP Magdeburg Refuge adapted to the terrain of the site (manholes of the septic tanks above the pond).
Loading pond
WWTP Magdeburg Refuge seasonal average max. week max. day loading [EW40] 13 53 98 BOD5-load [kg/d] 0.53 2.1 3.9 influent flow Q [m3/d] 0.5 1.1 3.0
Design of the pond (1. stage) according to the specific load and the retention time
(1) Specific load (seasonal average): BR ≤ 0,015 kgBOD5/m³ . d, V > 35 m³(2) Specific load (max. day): BR < 0,15 kgBOD5/m³ . d, V > 26 m³
(3) Retention time (seasonal average): tR³ 10 d, V > 5 m³
Required volume V = 35 m³
(available area A = 70 m², average depth h = 0,5 m)
Loading soil filter
WWTP Magdeburg Refuge seasonal average max. week max. day BOD5-elimination [%] 70 65 60 BOD5-load [kg/d] 0.16 0.74 1.56
Design soil filter (2. stage) according to specific load
(2) Specific load (max. day): BR < 0,05 kgBOD5/m³ . d, V > 31 m³
(1) Specific load (seasonal average): B R ≤ 0,005 kgBOD5/m³ . d, V > 32 m³
Required area A = 40 m²
(average depht h = 0,8 m according ÖNORM)
Energy demand
max. power
[W]max. electric work
[kWh/d]mean electric work
[kWh/d]200 0.2 0.1 (Qrezirkulation =0,9m3/d)
Treatment efficiency
date
[dd.mm.yyyy]
COD effluent [mg/l] NH 4-Neffluent [mg/l] NO 3-Neffluent [mg/l] COD elimination [%] N elimination [%] loading
[% of PW max ]24.08.2000 75 (310*) 20 (62*) 23 (0,8*) 92 54 22 09.07.2001 35 (220*) 15 (56*) 78 (0,5*) 97 29 10 * Concentrations in the pond