environmental benefit of wastewater treatment plants in mountainous areas in the alps
|
Comparison of technology, costs and environmental benefit of wastewater treatment plants in mountainous areas in the alps |
OSite description and boundary conditions
Design and treatment efficiency
maximum daily organic load [PE]
112 maximum hydraulic load [m3/d]
3.3 annual organic load [kg BOD/a]
200
altitude [m a.s.l.]
2238
sensitivity [hydrogeology, protected area ...] nature reserve, limestone
lagal requirements [BOD elimination]
80%
operation period [season]
summer
energy supply [type, kW]
photovoltaic, 1.7
aggregate, 3
means of transport [type]
supply cable car existing WWTP [type, condition, volume l/PE]
3-chambers, good condition, 72
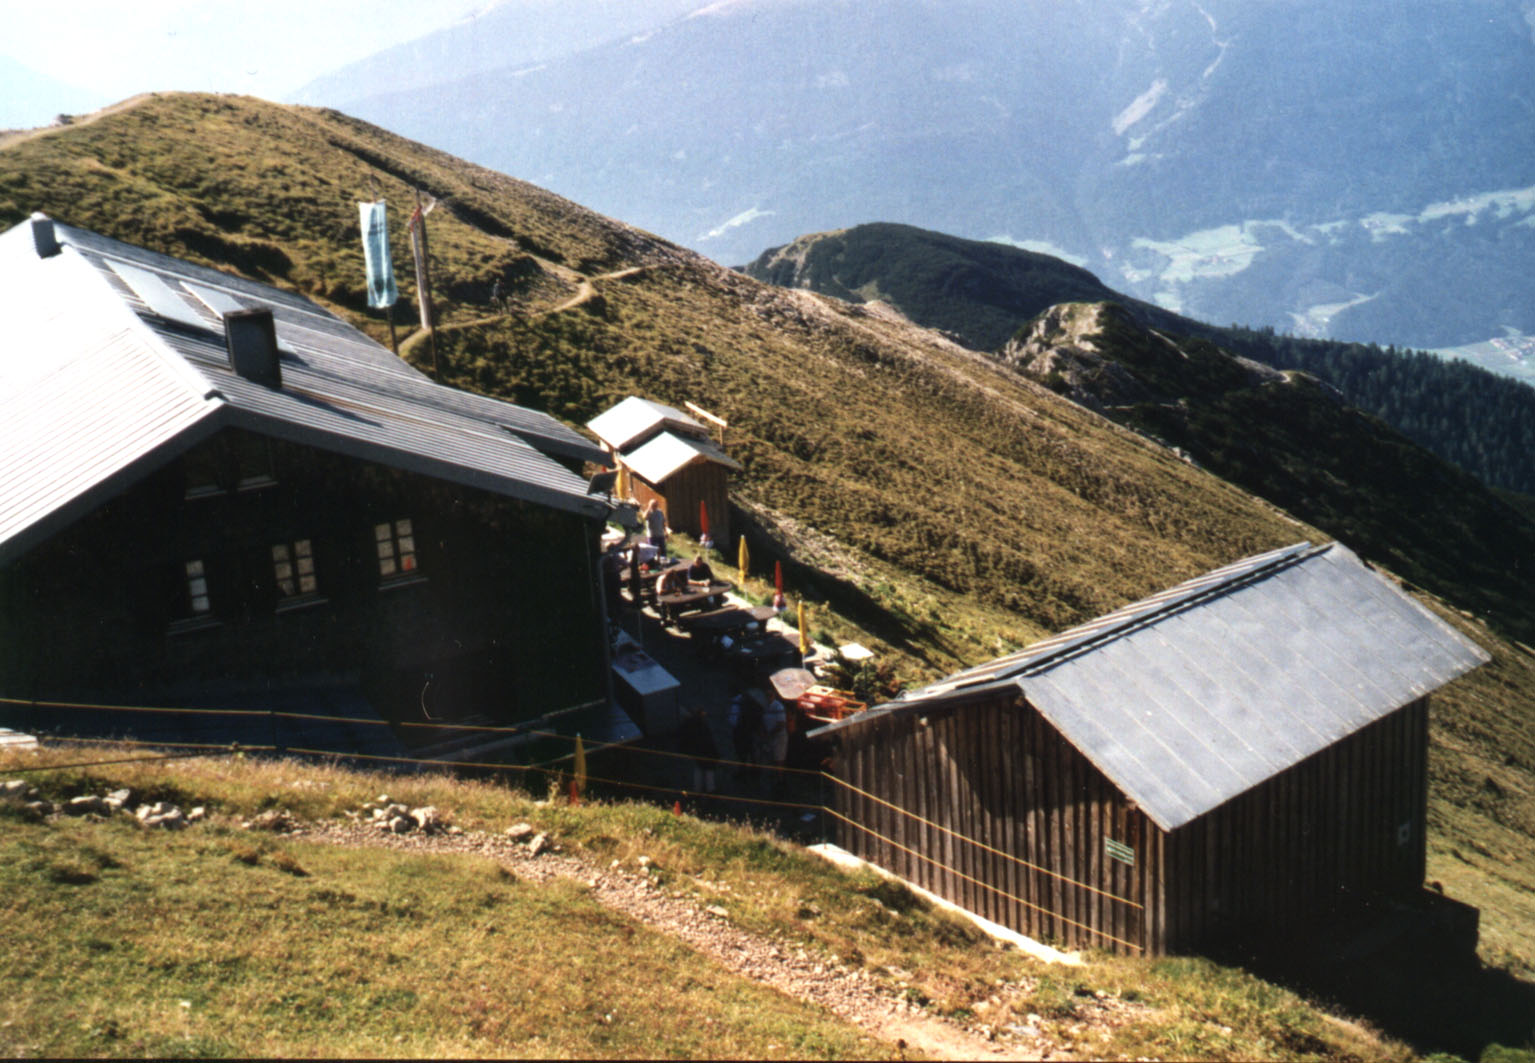
Fig. 4.35: Location of the Nördlinger Refuge at the wesr slope of the "Reither Spitze": Station of the supply cable car at the right hand side (with the photovoltaic panells supplying the WWTP) and the toilets and the WWTP in the back.
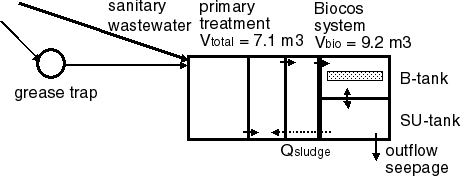
Fig. 4.36: Flow-scheme of the WWTP Nördlinger Refuge.
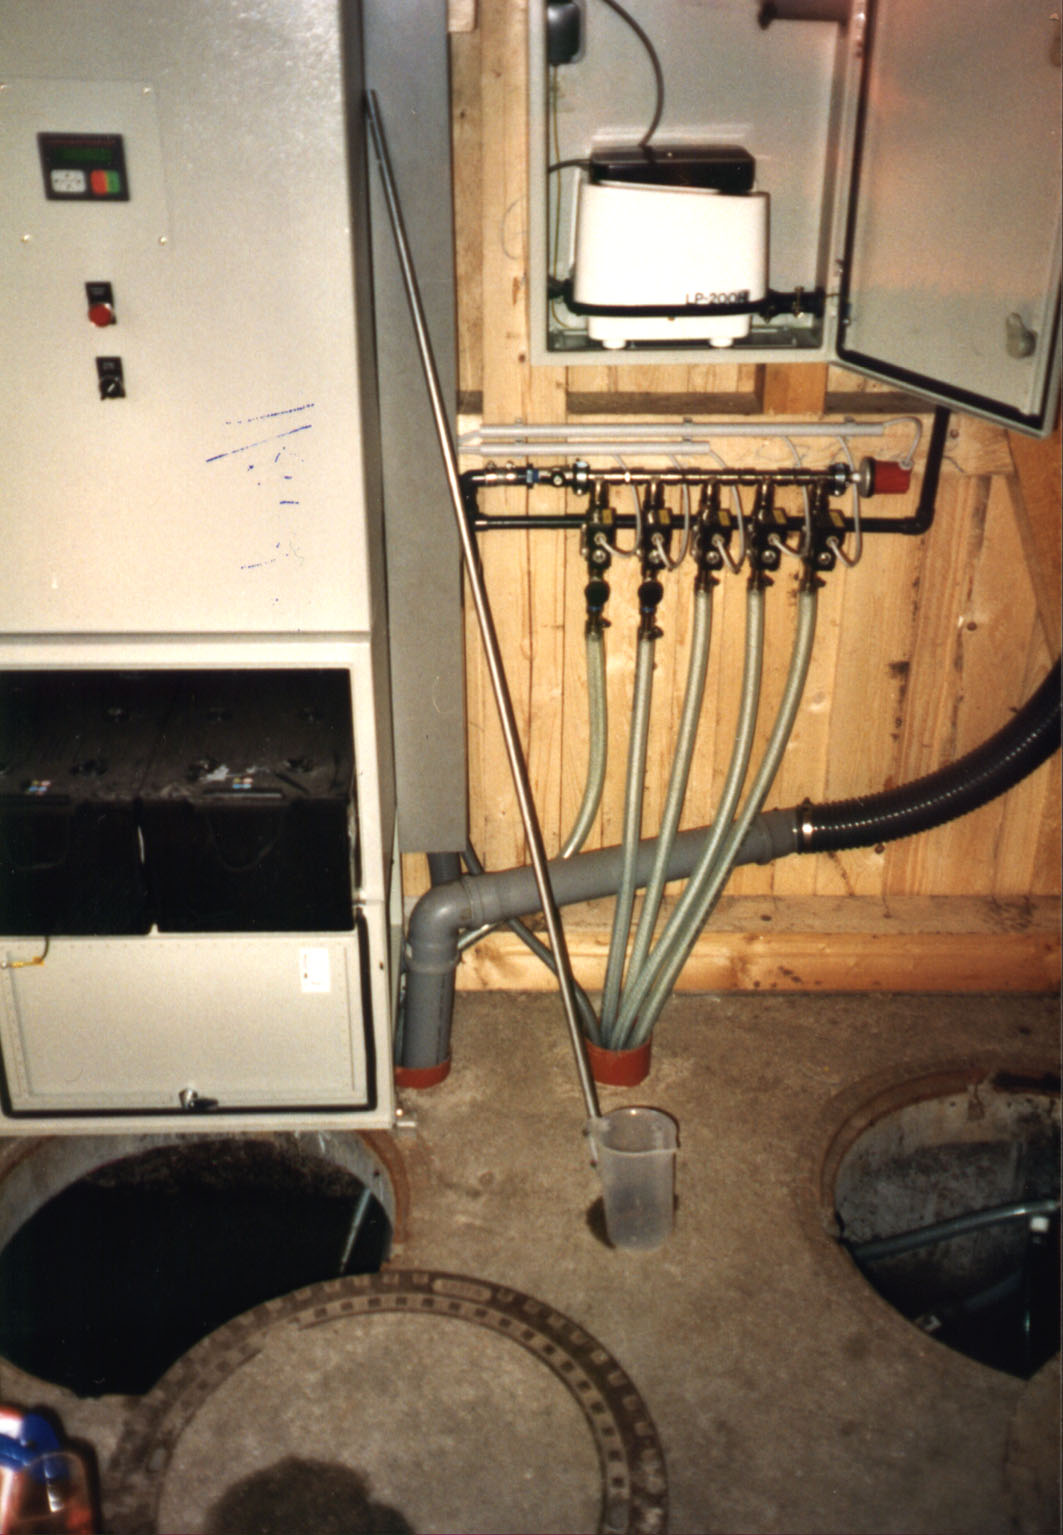
Fig. 4.37: Control box and batteries on the left hand side, compressor unit with magnetic valves and air tubes on the right hand side and the manholes of the Biocos-system below .
Loading of the biological treatment
WWTP Nördlinger Refuge seasonal average max. week max. day loading [EW40] 25 68 112 BOD5-load [kg/d] 1.0 2.7 6.7 influent flow Q [m3/d] 0.9 2.6 3.3
BDesign according to the F/M ratio in the max. week
Vaerob = 4.6 m3 (volumen B-tank) Maerob = 4.6 m3 x 3.3 kg SS/m3 x (18/24) = 11.4 kg SS (aerobic sludge mass)
BSS = 2.7 kg BOD 5/d / 11.4 kg SS = 0.24 kg/kg.d (aerobic sludge loading)
OB = 2.7 x 3 kg O 2 /kg BOD5 : 24 h = 0.34 kg O2/h (oxygen demand)
Energy demand
max. power
[W]max. electric work
[kWh/d]mean electric work
[kWh/d]250 6.0 4.2
treatment efficiency
date
[dd.mm.yyyy]
CODeffluent [mg/l] NH4-N effluent [mg/l] NO3-N effluent [mg/l] CODelimination [%] Nelimination [%] loading
[% of PEmax ]12.09.1999 405 53 3.4 95 94 23.08.2000 70 158 0,4 97 74 27.07.2001