environmental benefit of wastewater treatment plants in mountainous areas in the alps
|
Comparison of technology, costs and environmental benefit of wastewater treatment plants in mountainous areas in the alps |
Site description and boundary conditions
Design and treatment efficiency
maximum daily organic load [PE]
78 maximum hydraulic load [m3/d]
3.1 annual organic load [kg BOD/a]
180
altitude [m a.s.l.]
1930
sensitivity [hydrogeology, protected area ...] limestone
lagal requirements [BOD elimination]
80%
operation period [season]
summer
energy supply [type, kW]
photovoltaic
means of transport [type]
lorry existing WWTP [type, condition, volume l/PE]
2-chambers, poor condition, 38
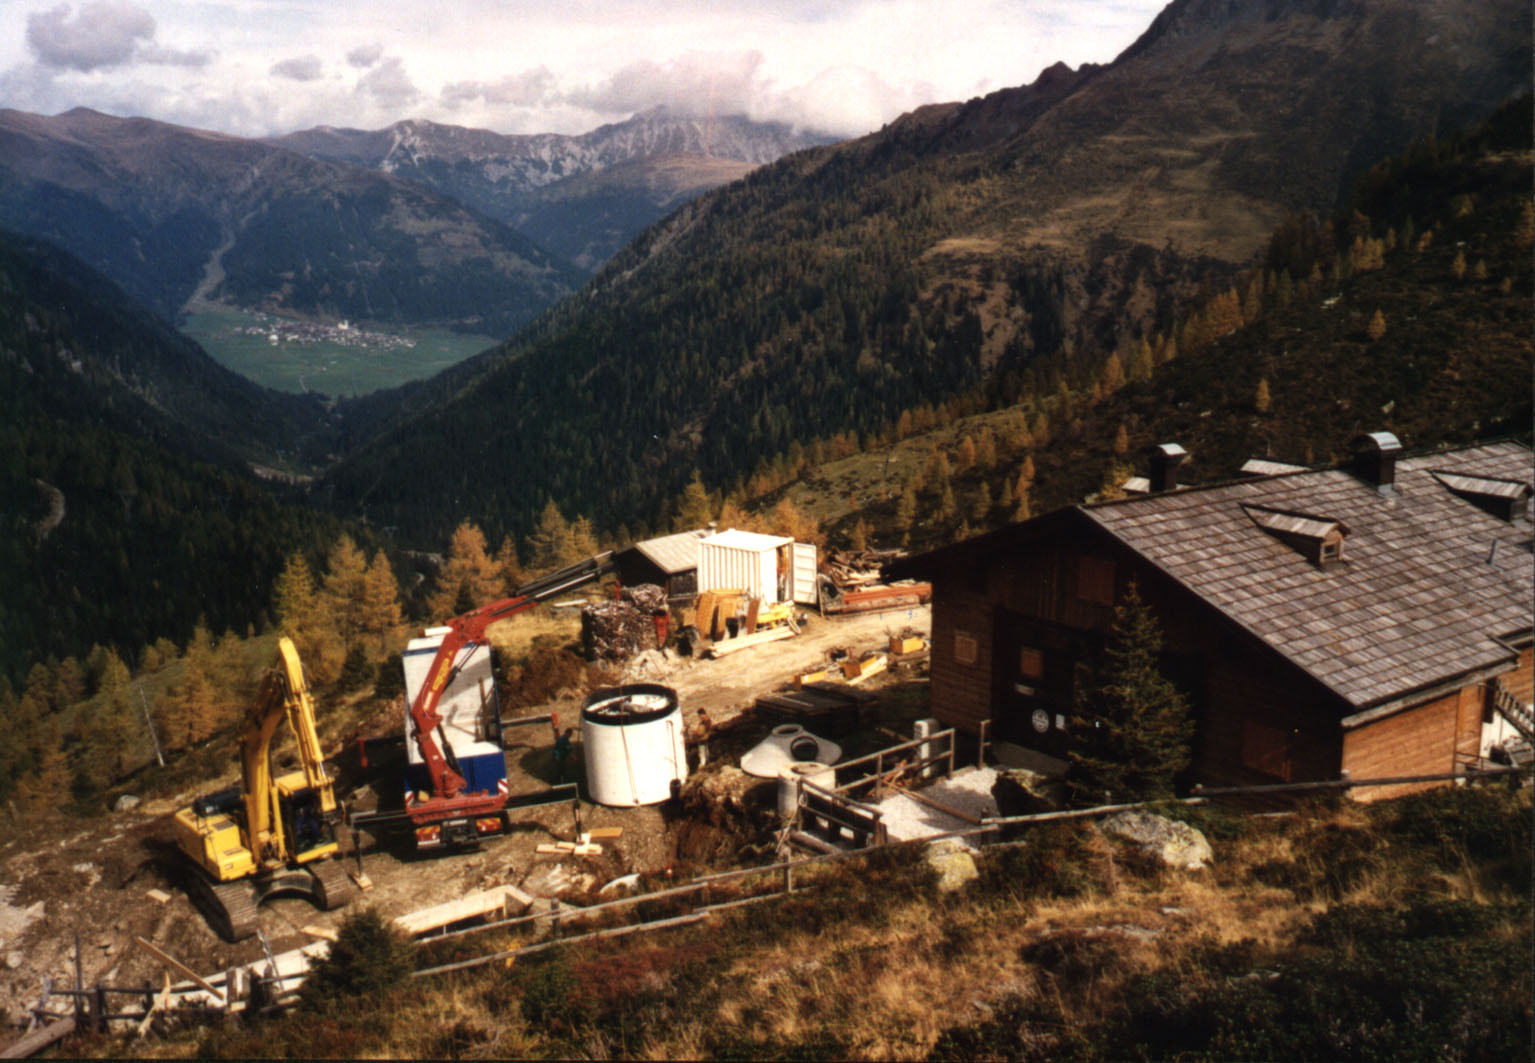
Fig. 4.38: View on the construction site of the WWTP Porze Refuge
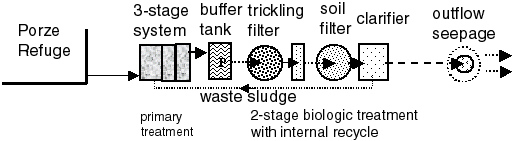
Fig. 4.39: Flow-scheme of the WWTP Porze Refuge
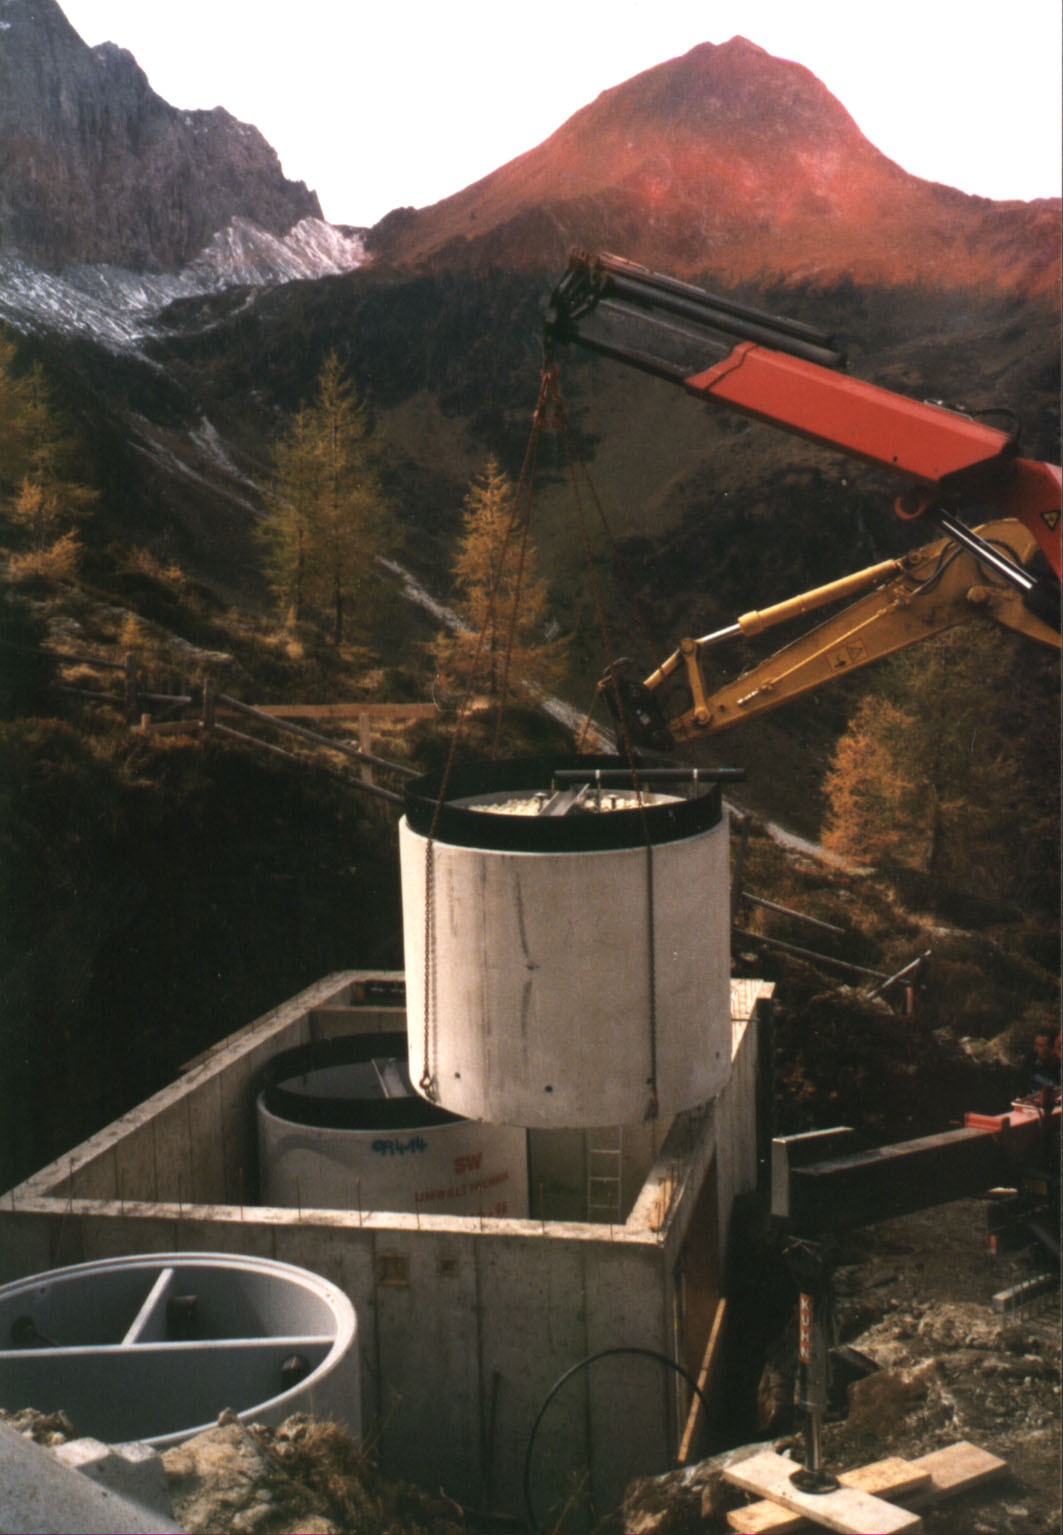
Fig. 4.40 : Installation of the trickling filter which is put on the concrete ceiling of the secondary clarifier tank.
Loading of the biological treatment
WWTP Porze Refuge seasonal average max. week max day loading [PE40] 30 59 78 BOD5-load [kg/d] 1.2 2.36 3.12 influent flow Q [m3/d] 1.5 2.4 3.1
Design of soilfilters according to the surface loading in max. week
BBF = 2 gBOD 5/m2.d (biofilm surface load)
VBF,required = 2.360 gBOD 5 /d / 2 gBOD 5 /m 2 .d = 1.180 m 2 / 150 m 2 /m 3 = 7,87 m
Ø 2.5m => Hne = 1,6 m (chamber for tricklingfilter and soilfilter)BSF = 2.360 gBOD 5/d x 0,1 / (7,87 x 80 m 2/m 3) = 0.38 gBOD 5/m 2.d (soilfilter surface load)
Energy demand
max. power
[W]max. electric work
[kWh/d]mean electric work
[kWh/d]250 – 1.000 2.2 0.6 bis 0.8
Treatment efficiency
date
[dd.mm.yyyy]
CODeffluent [mg/l] NH4-N effluent [mg/l] NO3-N effluent [mg/l] CODelimination [%] Nelimination [%] loading
[% of PEmax ]08.08.2000 95 30 68 93 48 45 11.09.2001 95 23 15 96 78 73