environmental benefit of wastewater treatment plants in mountainous areas in the alps
|
Comparison of technology, costs and environmental benefit of wastewater treatment plants in mountainous areas in the alps |
Site description and boundary conditions
Design and treatment efficiency
maximum daily organic load [PE]
150 maximum hydraulic load [m3/d]
10 annual organic load [kg BOD/a]
400
altitude [m a.s.l.]
2319
sensitivity [hydrogeology, protected area ...] limestone
lagal requirements [BOD elimination]
80%
operation period [season]
summer
energy supply [type, kW]
grid
means of transport [type]
supply cable car existing WWTP [type, condition, volume l/PE]
3-chambers, good condition, 223
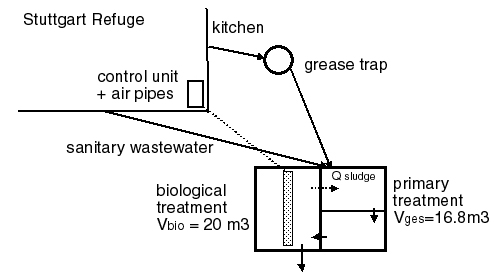
Fig. 4.41: Flow-scheme of the WWTP Stuttgart Refuge
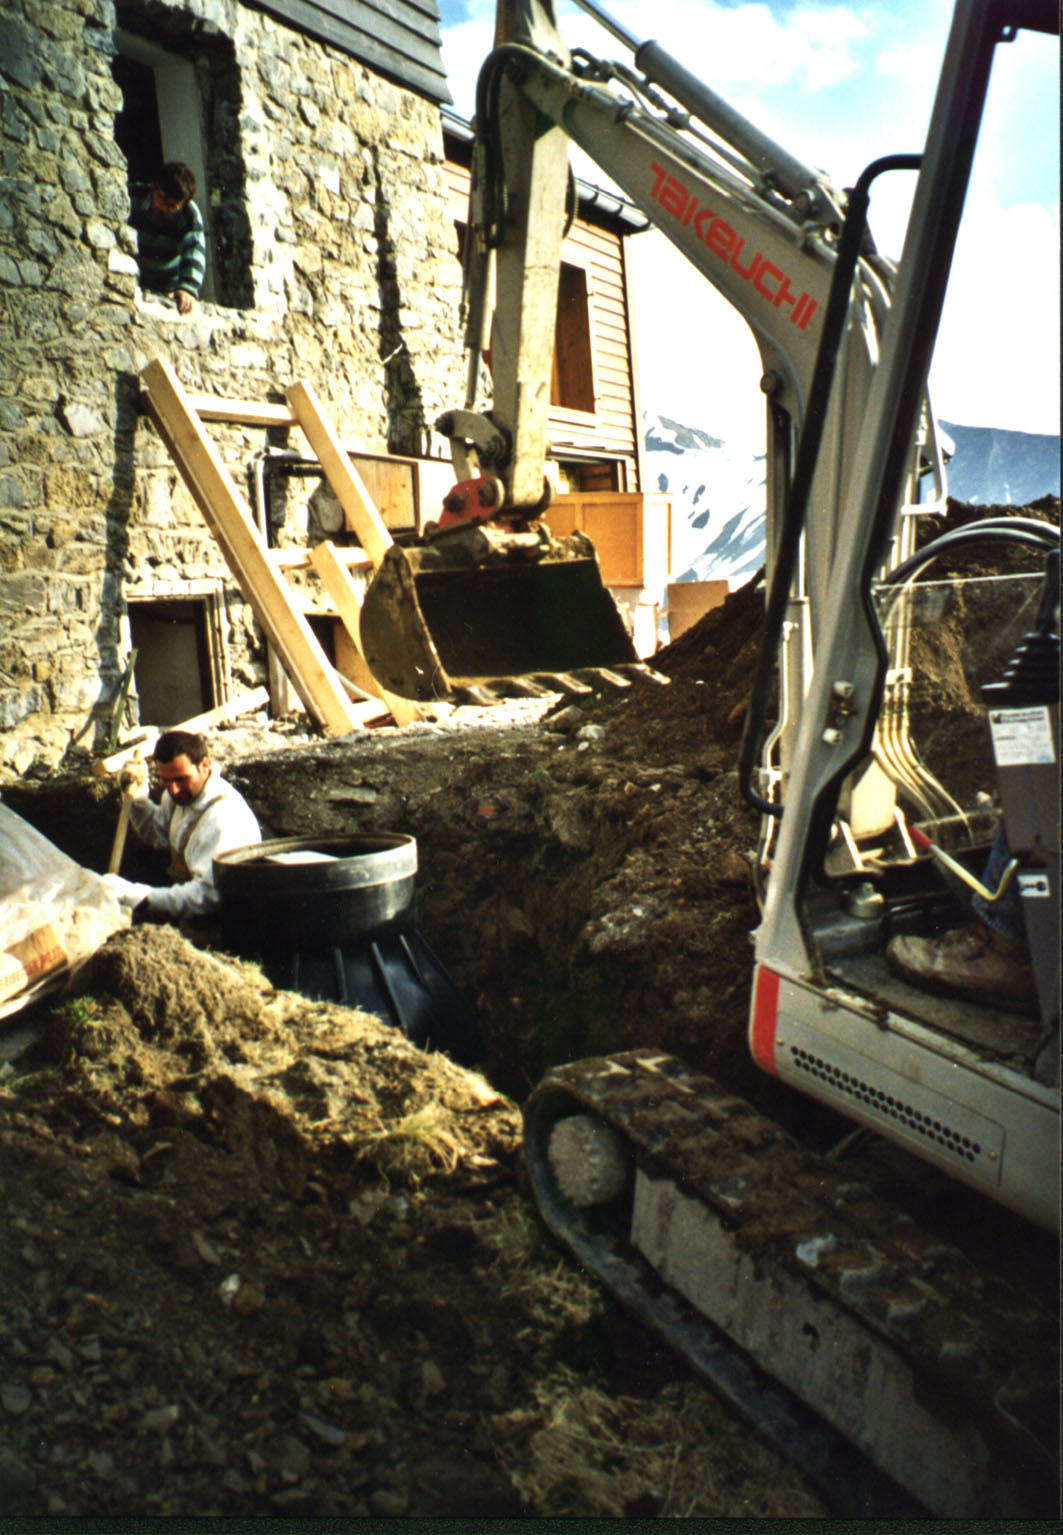
Abb. 4.42:Installation of a separate kitchen wastewater pipe and the PE-grease trap.
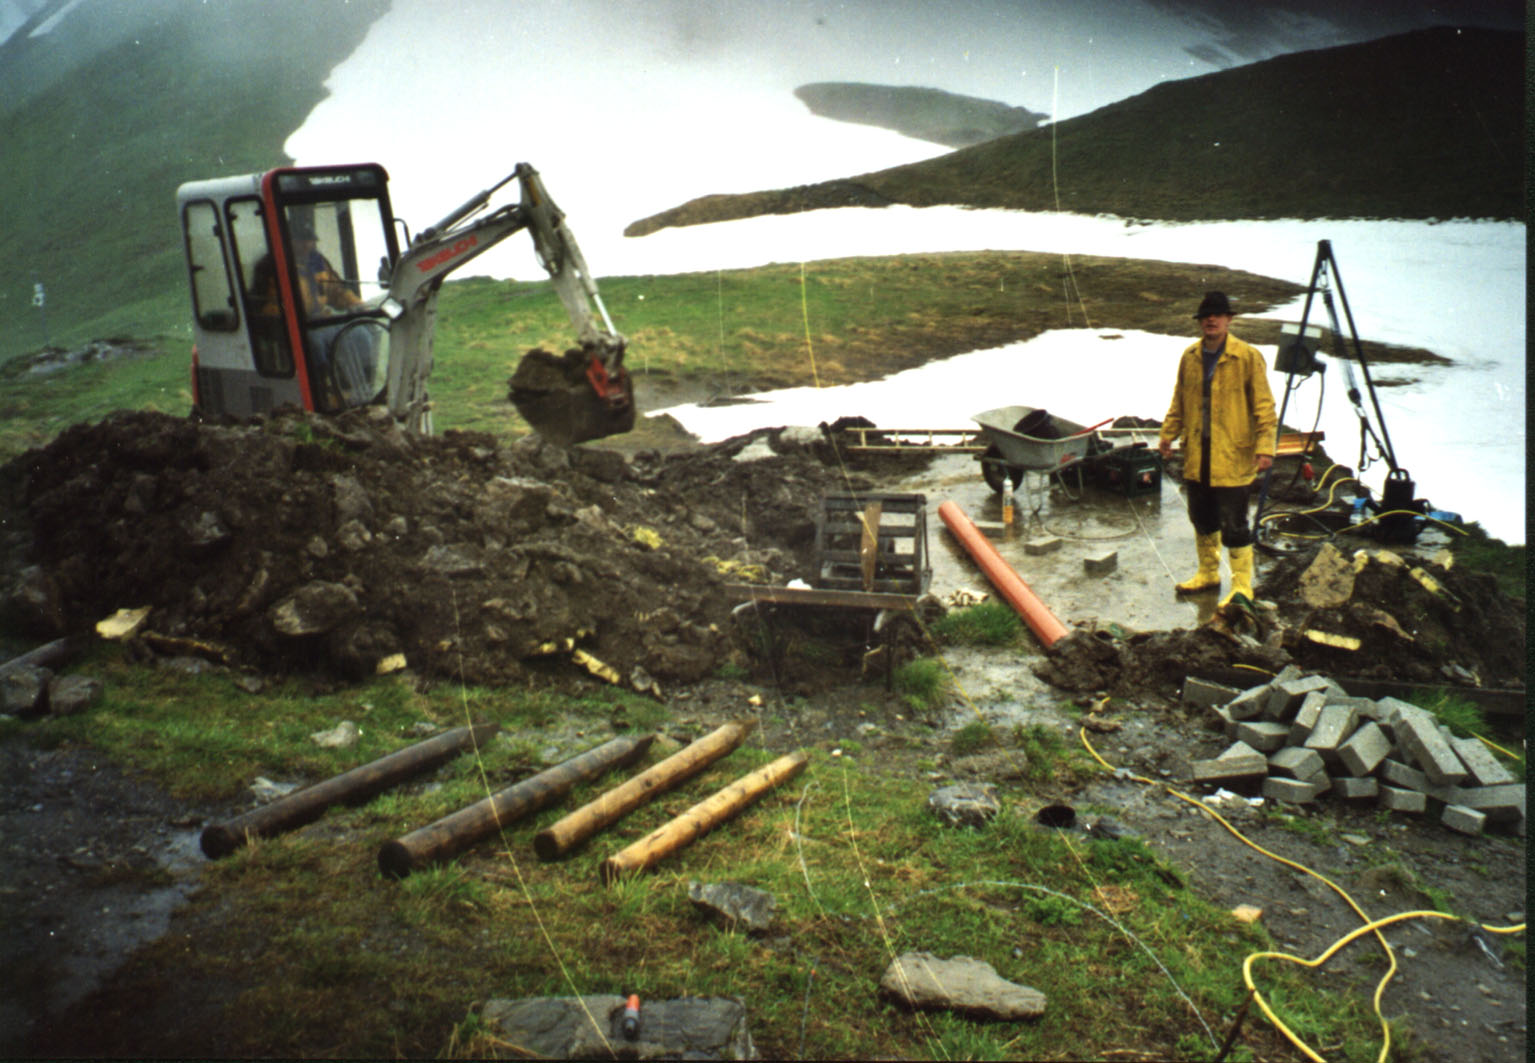
Abb. 4.43: Upgrading of the existing 3-chambers septic tank to a cyclic activated sludge system (typical alpine weather conditions).
Loading of the biological treatment
WWTP Stuttgart Refuge seasonal average max. week max. day loading [EW40] 56 118 150 BOD5-load [kg/d] 2.2 4.7 6.0 influent flow Q [m3/d] 3.9 7.3 10.0
Design according to the F/M ratio in the max. week
V = 20 m3 (volume tank)
Maerob = 20 m3 x 3.3 kg SS/m3 x (13.4/24) = 36.9 kg SS (aerobic sludge mass)
BSS = 4.7 kg BOD5 /d / 36.9 kg SS = 0.13 kg/kg.d (aerobic sludge loading)
OB = 4.7 x 3 kg O 2 /kg BOD5 / 24 h = 0.6 kg O2/h (oxygen demand)
Energy demand
max. power
[W]max. electric work
[kWh/d]mean electric work
[kWh/d]1.200 16 12
Treatment efficiency
date
[dd.mm.yyyy]
CODeffluent
[mg/l]NH4-N effluent [mg/l] NO3-N effluent [mg/l] CODelimination [%] Nelimination [%] loading
[% of PEmax ]06.08.1999 155 93 5,6 87 44 04.08.2000 85 84 2,2 94 15 21.09.2001