environmental benefit of wastewater treatment plants in mountainous areas in the alps
| Comparison of technology, costs and environmental benefit of wastewater treatment plants in mountainous areas in the alps |
Site description and boundary conditions
Design and treatment efficiency
maximum daily organic load [PE]
104 maximum hydraulic load [m3/d]
6 annual organic load [kg BOD/a]
380
altitude [m a.s.l.]
2260
sensitivity [hydrogeology, protected area ...] limestore
lagal requirements [BOD elimination]
80%
operation period [season]
summer
energy supply [type, kW]
aggregate
means of transport [type]
lorry
existing WWTP [type, condition, volume l/PE]
3-chambers, poor condition, 432
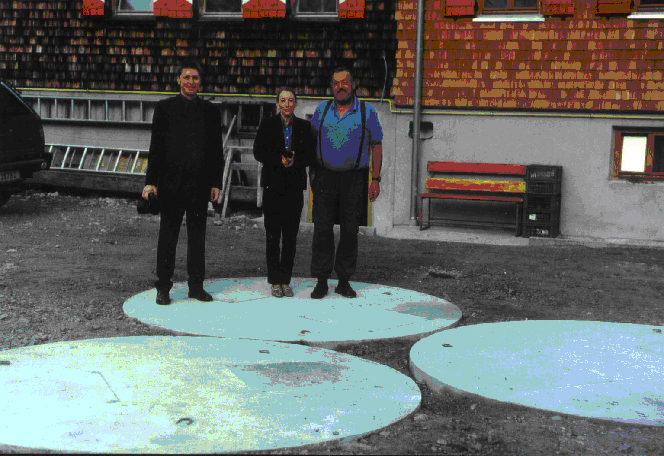
Fig. 4.23: The 3 tanks (prefabricated concrete parts) of the new WWTP at the backside of the Karlsbad Refuge (with Life-monitoring team and refugist)
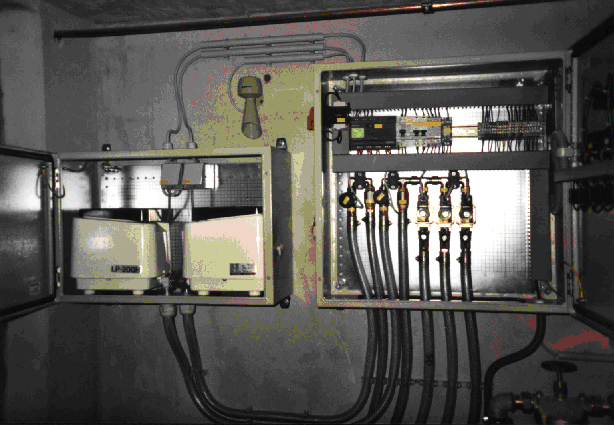
Fig. 4.24: Doubble compressor unit and programmable control unit with magnetic valves in order to control the air flow.
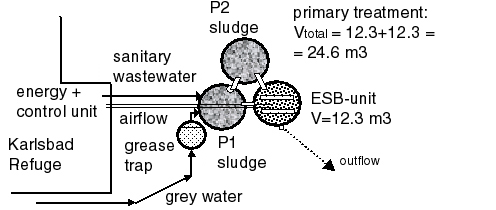
Fig. 4.25: Flow-scheme of the WWTP Karlsbad Refuge
Loading of the biological treatment
WWTP Karlsbad Refuge seasonal average max. week max. day loading [PE40] 50 80 104 BOD 5-load [kg/d] 2.0 3.2 4.2 influent flow [m3/d] 3.5 5.5 7.0
Design according to the F/M ratio in the max. week
V = 12.3 m3 (volume B-tank)
Maerob = 12.3 m 3 x 4 kg SS/m3 x 0.4 = 20 kg SS (aerobic sludge mass)
BSS = 3.2 kg BOD 5 /d / 20 kg TS = 0.16 kg/kg.d (aerobic sludge load)
OB = 3.2 x 2 kg O2 /kg BSB5 / (24 h x 0.4) = 0.67 kg O2/h (oxygen demand)
Compare chapter "oxygen demand"
Energy demand
max. power [W] max. electric work
[kWh/d]mean electric work
[kWh/d]1 125 10 7.2
Treatment efficiency
date
[dd.mm.yyyy]
CODeffluent [mg/l] NH4-Neffluent [mg/l] NO3-Neffluent [mg/l] CSBelimination [%] Nelimination [%] loading
[% of PWmax ]06.10.2000 585 115 1.0 74 42 23.07.2001 120 7 1.0 92 96